

Picture the executive slide. New code delivered per release, before AI and after. The bar on the right is three times the height of the bar on the left. Someone in leadership says "3x", someone else says "there's the ROI", and the board meeting moves on.
The number is real. It's also only one-third of the picture.
TL;DR — Measuring AI coding productivity requires three numbers read together: how much code landed in the release (volume), how much existing code was changed or deleted (rework), and how many defects came with it (defects). Each one is honest about one thing and silent about the rest. Compare all three against your own organization's history before AI, and the true picture is hard to misread.
Why Isn't Code Volume Enough to Measure AI Productivity?
Take an illustrative engineering team. Since AI coding tools arrived, the new code shipped in a typical release has tripled.
This isn't the "lines generated" figure an AI tool reports about its own completions. Those activity metrics measure tool engagement, not delivery. Volume here means actual committed code that made it into production releases. Tripling it certainly means something: the team is producing more raw output, and generative tools are part of how.
What volume cannot tell you is whether that code stayed.
What Is Rework, and Why Does It Rise with AI?
Rework, as we define it here, is existing code that gets changed or deleted in a release. For our illustrative team, rework went up 5x over the same period.
Read in isolation, this number also misleads. A release with heavy changes to existing code might simply be a long-overdue architectural refactor, which represents healthy, necessary engineering work. But the team refactored code before AI as well, so baseline refactoring is already baked into the pre-AI benchmark.
What matters is the shift relative to volume:
- New code added went up 3x.
- Existing code touched or deleted went up 5x.
- All with the same team doing the same fundamental type of product development.
Before AI, the team touched one existing line for every four lines it added. Now it touches three existing lines for every six added. Code is being written, checked in, and then rewritten almost immediately.
What Do Defects Add to the Picture?
Defects per release doubled (2x).
Alone, this metric also allows two opposing interpretations. An executive might argue that because the team shipped far more software, carrying more bugs is a natural byproduct of increased velocity. Whether a 2x defect rate represents an acceptable tradeoff depends entirely on what it is measured against.
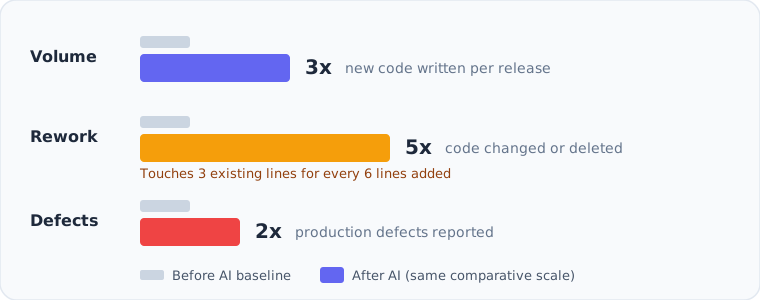 Change since AI adoption for one illustrative team: Volume 3x, Rework 5x, Defects 2x
Three numbers for one illustrative team, per release. Each is true. None of them provides the answer on its own.
What Happens When You Read All Three Together?
Start by reading volume and rework together.
Before AI, roughly three out of every four newly added lines lasted into subsequent releases. Now, roughly three in six lines survives. When you triple the gross volume at that diminished survival rate, the net lasting code retained in each release comes out about a third lower than before.
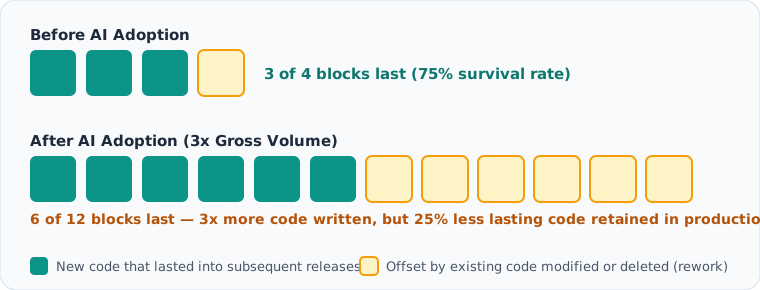 Code written versus code that lasted, before and after AI: Gross output triples while lasting output drops
Gross output tripled while lasting output fell by a third. The team is typing and prompting three times as much code to end up with less retained value.
Now add defects into the equation. Defects doubled while raw lines written tripled. If you calculate traditional defect density (defects divided by total lines written), the defect rate appears to fall by a third. On an executive dashboard, software quality seemingly improved.
Any metric with lines written in the denominator gets artificially better when AI tools inflate the lines.
Most of those generated lines never lasted. Defects doubled while lasting code shrank. Measured against the code that actually stayed in production, the true defect rate tripled.
| Core Metric | Read in Isolation | The False Assumption | The Reality When Combined |
|---|---|---|---|
| Volume (New code per release) | 3x increase | "The team is shipping 300% faster with AI assistance." | Output tripled, but only 1 in 6 lines survived past the next sprint. |
| Rework (Code changed / deleted) | 5x increase | "The team is finally doing healthy architectural refactoring." | Rework outpaced new code by over 3x; code is churned and rapidly rewritten. |
| Defects (Bugs escaping per release) | 2x increase | "Defect density dropped because lines increased by 3x." | Evaluated against code that lasted, customer defect density actually tripled. |
Any one of these numbers could have carried an executive slide. Volume alone says 3x. Defects per line written says quality improved. Read together as a triad, they reveal a team working substantially harder to deliver less lasting software, while customers experience twice as many production defects.
The Same Three Numbers Can Prove the Gain
Run the exact same diagnostic on a different team. Volume is also 3x. Rework doubled (2x). Defects rose only 20% (1.2x).
This team now touches only one existing line for every six it adds, a marked improvement over its pre-AI baseline. Lasting code per release is more than 3x higher, and defects per lasting line fell by nearly two-thirds. This team's 3x gain is genuine, and the exact same framework that catches hidden friction confirms real productivity:
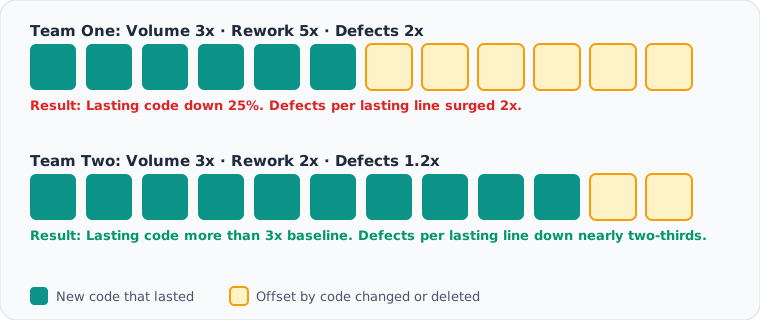 Two teams with the same 3x volume and opposite outcomes: Team one churns code while Team two compounds delivery
| Delivery Metric (per release) | Team One (High Churn) | Team Two (Compounding Gain) | Strategic Takeaway |
|---|---|---|---|
| Volume: new code added | 3x baseline | 3x baseline | Identical headline on executive slides |
| Rework: code changed/deleted | 5x baseline | 2x baseline | Touches 3 lines per 6 added vs 1 per 6 |
| Defects per release | 2x baseline | 1.2x baseline | Quality held firm despite increased velocity |
| Code that lasted in production | Down 25% | Up 300%+ | Net lasting code retained per release |
| Defects per lasting line | 2x higher | Down nearly 67% | True quality experienced by end users |
The headline number is identical on both teams' progress reports. Only rework and defects reveal whether velocity is building software or churning it.
How Do You Run This Read on Your Own Team?
You can establish a reliable baseline using data your organization already generates. The diagnostic framework follows four steps:
- Pick the boundary. AI adoption is rarely an instantaneous cutoff. Identify the quarter when AI coding tools reached widespread adoption across the team. That boundary provides a clear before-and-after baseline.
- Pick the unit, and keep it consistent. Comparing per release works well if release cadences remained consistent across the adoption boundary. If release frequency changed, evaluate per calendar month. Use the exact same time unit on both sides.
- Compute the three multiples. Calculate new lines landed, existing lines changed or deleted, and verified production defects, each as post-adoption divided by pre-adoption baseline. Exclude auto-generated code, vendored dependencies, schema migrations, and lockfiles to prevent artificial distortion.
- Read them as an interdependent set. If rework increased significantly faster than volume, your engineers are re-doing work. If defects outpaced the code that actually lasted, delivery quality is slipping regardless of what defect density graphs indicate. Always compare a team against its own historical baseline, never against a different team with different domain constraints.
Where Should You Look When the Read Is Bad?
A problematic diagnostic read doesn't mean AI coding tools have failed. It typically means code generation scaled rapidly while the systems around it remained static.
Three specific areas warrant immediate investigation:
- Review Capacity and Reviewer Fatigue: Code volume tripled overnight, but senior reviewer hours remained unchanged. When human review time is distributed equally across a deluge of PRs, complex changes receive the same cursory minutes as boilerplate. Critical omissions slip through, surfacing a release later as rework or defects.
- Upstream Ticket Specifications: AI assistants write code directly from written requirements. Provide an ambiguous or incomplete specification, and the tool generates syntactically clean code that does the wrong thing. Engineers discover the disconnect post-merge, triggering costly rework cycles.
- Architectural & Interface Guardrails: Without clear interface boundaries and automated contract testing, rapidly generated local changes frequently disrupt neighboring services. What looked fast in isolation causes compounding churn across downstream dependencies.
Why Lines of Code?
A line added, modified, or deleted is recorded consistently across every repository, team, and version control system. This makes it an objective, stable primitive for comparing a team against its own historical record.
High-level units of planning, such as story points, epics, or ticket counts, serve a different purpose. They fluctuate based on team estimation practices, sprint slicing, and shifting backlog grooming habits, making historical comparisons fragile.
However, two non-negotiable conditions must govern this analysis:
- Team and organization-level analysis only: Lines of code must never be used to rank, evaluate, or score individual developers.
- Never read volume in isolation: Volume is an incomplete metric without immediate correlation to rework and defects.
Why Does This Take an Event Record?
Most conventional engineering analytics platforms poll developer tools on scheduled intervals and record state differentials between snapshots. But rework happens between clean states: the comments requested, the mid-sprint revert, the forced push, and the second pass.
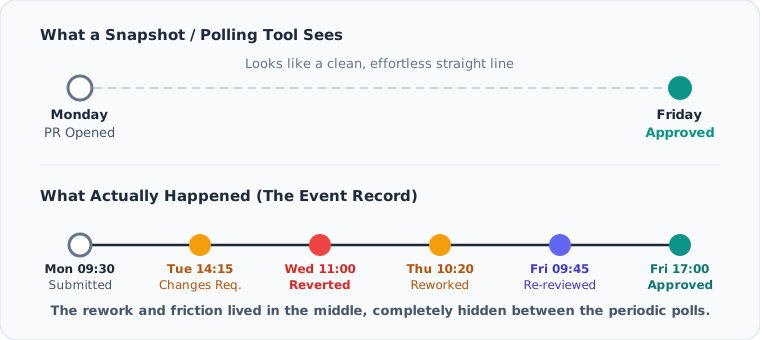 One pull request seen by a snapshot tool and by an event record: A clean line versus the messy reality
When an engineering system samples periodically:
- Intra-sprint churn is erased: A pull request opened Monday and merged Friday looks like smooth, linear progress, even if it underwent multiple rejections, reverts, and architectural revisions.
- Lineage is lost: Snapshot tools cannot tell whether code merged this week was rewritten to fix code merged last week.
- Root causes stay invisible: Without granular event capture, organizations cannot distinguish between healthy feature evolution and frantic defect remediation.
CleverDev captures engineering events continuously as they occur across version control, issue trackers, CI/CD pipelines, and incident response systems. It constructs the living lineage behind every line of code: why it was written, why it changed, and what it impacted downstream.
Because this complete event record already exists in your historical systems, your pre-AI baseline can be reconstructed accurately without waiting months to collect new data.
What We Didn't Do: The Myth of Line-by-Line Attribution
Nothing in this methodology depends on determining which specific lines were written by AI versus human developers.
Attempting to attribute code line-by-line is fundamentally flawed. In modern workflows, an engineer prompts an initial draft, rewrites half of it, integrates human-written functions from last year, and refactors it two weeks later. Drawing an artificial boundary through that collaborative loop produces metrics that collapse under basic engineering scrutiny.
The defensible approach is temporal: compare your organization's delivery outcomes before AI adoption against its delivery outcomes after AI adoption, across the exact same three metrics. It measures real business impact regardless of how code was authored.
Find Out on Your Own Data
Pick one team, one program, or one critical service. CleverDev connects directly to the development tools you already run, reconstructs your pre-AI baseline from your historical event logs, and surfaces all three metrics side by side.
Everything deploys securely inside your own infrastructure, on-premise or within your private VPC.
Frequently Asked Questions
Yes, and that's why the comparison is against your own baseline. Refactoring, feature evolution, and deleting dead code all happened before AI too, so they're already counted in the before number. What matters is the shift: when changes to existing code grow much faster than new code, with the same team doing the same kind of work, code is being written and then rewritten.